


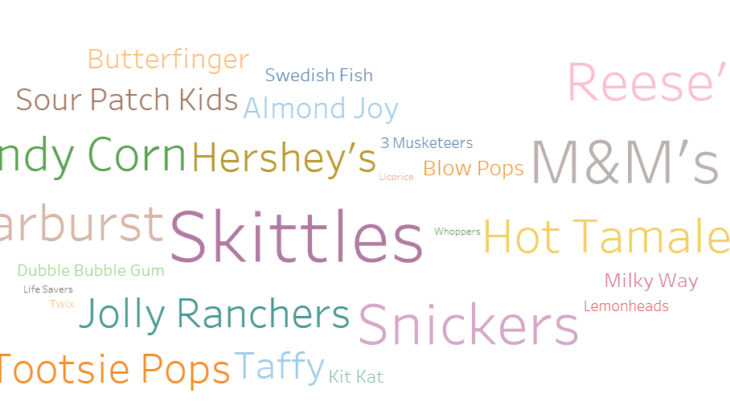
Word cloud is used to visually represent Text data.
Word Cloud in Tableau consists of text in a dimension, the size of each word represents the frequency or importance.
Word Cloud is a good way to show which text are more popular.
In this blog, I will use Word Cloud in Tableau to show which Candies are more popular in Halloween.
I will use the Top 25 Candies by Quantity Sold (in pounds).
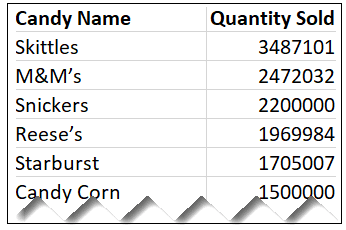
The data source used has the following format,
Creating Word Cloud in Tableau
- Connect and load the data in Tableau desktop. Data set has one Dimension – Candy Name and One Measure – Quantity Sold.
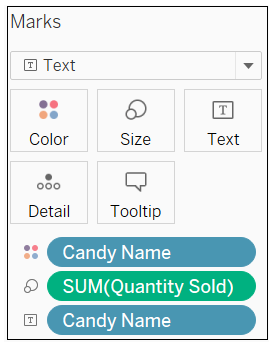
- Place Candy Name on Text under Marks.
- Place Quantity Sold on Size under Marks.
- From the Marks, change the display to Text.
- Place Candy Name on Color to show the Word Cloud in different colors.
- Your Marks card should appear like
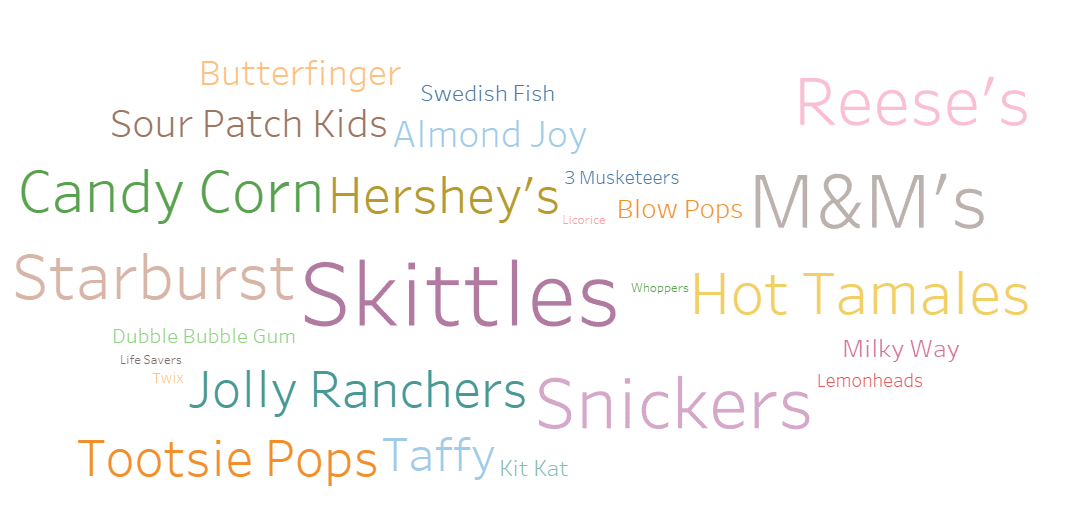
This will give you the Word Cloud of Candy Names where size of the text represents the amount of quantity sold.
References :


 : http://techkoncepts.com/
Thanks Chandraish for this. It was pretty interesting.