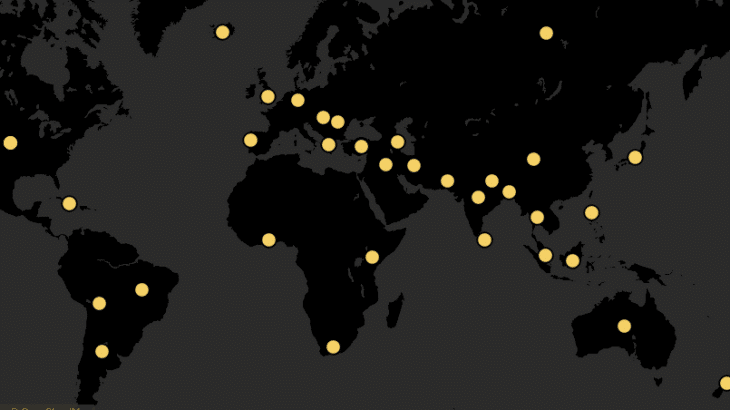
Using Tableau visualization, let’s find out which countries first experience New Year according to their location and time zone. It takes London as the base time. In this step-by-step tutorial, you will learn how to create such a Map and using Pages feature in Tableau you can animate it. For more details visit : Which […]
Maps in Tableau
How to Integrate Tableau with Map Box Services
We can create maps in Tableau to analyze the data based on geographical locations. The map based analysis provide more enhanced and realistic picture of the data. We can create any level of maps in Tableau. To create a map, you need longitude and latitude of the geographical location. I will go on to show […]
How to drilldown from County Map to Zipcode Map in Tableau
In dashboards, drill down facility provides good user experience. Using drill down users can go down to the level of details. In this article, i will show how to drill down from County to Zipcode level of Maps. The objective here is to create 2 Maps, one for County and one for Zipcode. When user clicks […]
How to Create Maps in Tableau
One of the strong features of Tableau is to create interactive Maps. Tableau automatically creates maps for the fields with geographical roles such as Country, City, Zipcodes etc. Tableau automatically generates Longitudes and latitudes for such fields. In this blog, i will create a Map using OHIO counties and Zipcodes. I have created a sample data set using […]