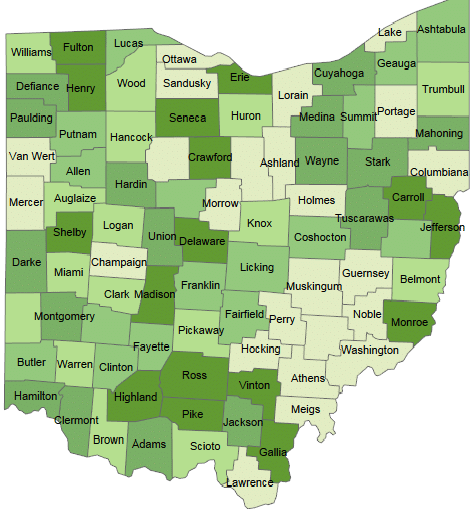
Tableau – Color coding

It is very useful to perform color coding in your visualization. You can show values which are above or below a threshold value in a different color. In Tableau you can achieve this by using a calculated field. Steps: Create a visualization according to your requirements Create a calculated field on the column you want […]

Continue reading


Tableau – Applying filters

Filters can be applied in Tableau to dimensions and measures. Filters are a good way to answer questions on different data scenerios. Steps: Create visualization according to your requirements Understand the business rule for your filter Drop field which you want to use for filter on the “filter shelf” Tableau will prompt “How do you […]

Continue reading


Tableau – Data connection

Tableau can connect to variety of data sources. It can connect to excel files,relational data bases and many more. When you launch Tableau desktop on your machine, connect screen opens up. Here you can connect to your desired data source. If you have trial version of Tableau desktop then you can just connect to file based data sources. With […]

Continue reading


Tableau Overview

If you are here that means you are an ardent follower of Business Intelligence. Tools like Tableau have changed the way users consume BI data. I came across Tableau few year back and was excited by its visualization and ease in data analysis. Tableau 8.0 is taking a big step in dash boarding and predictive analysis. […]

Continue reading