


Tableau Training Seminar June 4th,2016 Time : 3pm EST Address: 5900 Sawmill Road Dublin, OH 43017 Goto meeting links available. Contact chandraish@gmail.com
Cross table in Tableau

Cross table in Tableau is a special data structure where data is presented in a row and column format. See an example of a cross table below. This is a Sales Report of some fictitious company. This report shows the sale of Products by Employees to respective customers. Problems with loading Cross table in Tableau […]
How to dynamically generate a chart based on measure selection
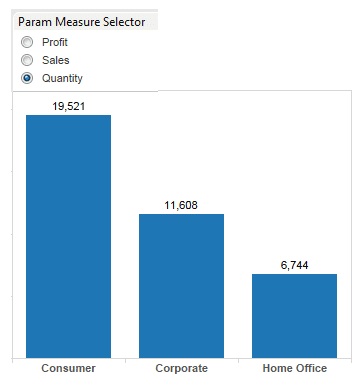
In this blog, I will discuss, how to dynamically generate a chart based on measures. Depending on the business requirement, sometimes you may have lot of key measures in your data. In such situation, you have a choice to – create separate chart for each measure or to create one chart and change the chart […]
Displaying multiple trend lines on the same axis in Tableau
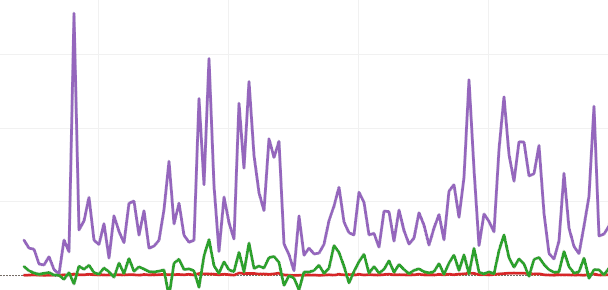
In my previous article we saw how to display 2 measures on a dual axis. Sometimes displaying multiple trend lines on the same axis in Tableau is necessary. In this article we will see how to achieve this requirement. Measure Names and Measure Values in Tableau Tableau automatically creates Measure Names and Measure Values in […]
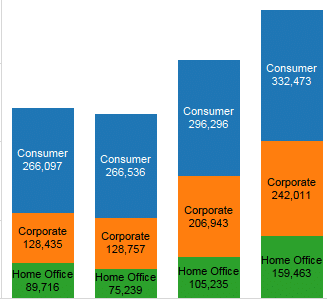
How to create Combination Chart in Tableau
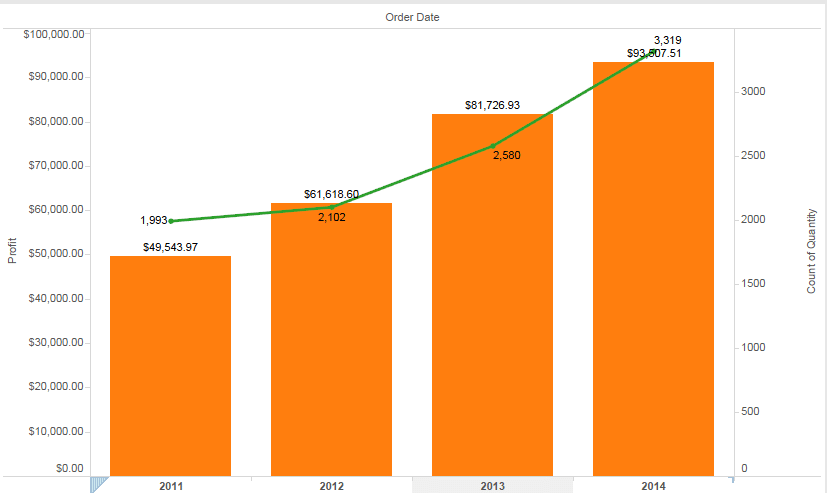
In this post I will How to create Combination Chart in Tableau. Combination charts or Combo charts are useful when you have to display two different units of data on the same chart. As the name suggest, combination chart is a combo of two charts. It can be a bar and a line chart or […]
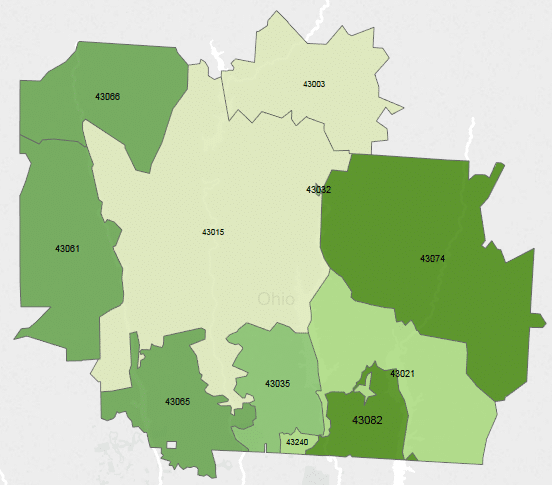
How to display county outline over zipcode map
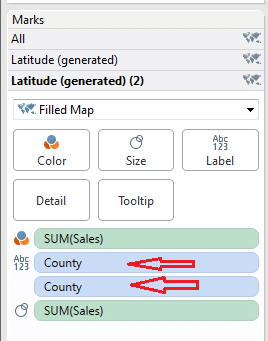
In my last article drill down maps, i worked on how to drill down from County to specific Zipcode map. In this article i will discuss how to create county outline/boundary over zipcode map in Tableau. Sometimes Zipcodes overlap between the counties and in such scenarios it is important to see the county outlines. If […]
How to drilldown from County Map to Zipcode Map in Tableau
In dashboards, drill down facility provides good user experience. Using drill down users can go down to the level of details. In this article, i will show how to drill down from County to Zipcode level of Maps. The objective here is to create 2 Maps, one for County and one for Zipcode. When user clicks […]
Important keywords in Tableau
Tableau is an awesome tool for creating visualizations. A developer will use Tableau desktop to create charts,tables and maps. Before starting on Tableau development, it is good know the important keywords and concepts as used in Tableau. Important Keywords in Tableau 1. Data – When you launch Tableau desktop , the first thing you do, […]
How to create different Charts in Tableau – Part 2
In my previous post how-to-create-different-charts-in-tableau-part-1 you have learned how to create Text table,Heat Maps,Maps and Pie charts. In this article i want to share with you some other types of charts. I will use Superstore.xls as data source. Superstore.xls comes with your Tableau installation and can be located in \Documents\My Tableau Repository\Datasources\ 1. Bar Chart Bar chart […]
How to create different Charts in Tableau – Part 1

Tableau provides whole range of Charts for data analysis. Given your data and requirements ,it is important to know which charts are best suited. In this blog, i will tell you how to create different types of charts in Tableau. I will use Superstore.xls as data source. Superstore.xls comes with your tableau installation and can […]


 : http://techkoncepts.com/