


Tableau 10 provides more power to the developer and business user in the world of Data Analytics. Tableau 10 for Beginners covers Tableau 10 concepts in an easy-to-understand manner. It provides ample exercises.Sample workbooks are available on Tableau public for download. Dataset and workbooks can also be downloaded from LearnTableauPublic.com. Visit Book resource tab on […]
Tableau developer – First few days at work
Congratulations!!! your dream came true and you have been hired as a Tableau developer. Now you need to know things to be successful and to provide value to your client. a. Get a licensed copy of Tableau desktop Tableau desktop is used for developing sheets, dashboards and data story. Tableau offers two weeks of trail version, […]
Tableau Training
Want to make a career in Business Intelligence ? Want to help your client with cool visualizations ? Learn Tableau and become an expert in Data visualization. 40 hours of Training Start from BI concepts and learn basics to advance concepts in Tableau Hands-on training, do exercises with the instructor Limited candidates per class, […]
What are Floor and Ceiling functions in Tableau ?
Floor and Ceiling functions belongs to number functions in Tableau. Ceiling: This function helps in rounding a decimal value to greater or equal value. Floor: This Function in tableau helps to round an integer to is Lesser values or equal value. Example: Sum of sales = 2,,297,200.8603 Floor(sum(Sales)) Floor of sales = 2,297,200.000 Ceiling Function […]
Identify Dimensions and Measures
Being able to identify dimensions and Measures is very important in any Business Intelligence implementation. An understanding of these concepts are important for learning Tableau. Exercise: Use the table below and Identify Dimensions and Measures. Post your answers in the comments section.
How to remove the All options in the filter in Tableau
In Tableau, Filters are used to filter the data displayed in the view section. Filters can be of displayed in different ways, such as; Multiple values drop down, Multiple value list, Single Value list and so on. Knowing how to remove the all options in the filter in Tableau is important to view specific data. […]
How Tableau visualizations can be viewed
Tableau desktop is used to create visualizations in Tableau. What is Visualization Visualization means pictorial representation of data. This representation can be in the form of charts, tables, maps and so on. Visualization helps in gaining understanding of the data. We will discuss How Tableau visualizations can be viewed Using Tableau desktop, developer connects to data, preps […]
LOD calculations
As part of Tableau Questions and Answers series, I am asking questions related to Tableau and data warehousing concepts, for this post I am asking about LOD calculations. I will encourage my students and other readers to explore the answers and reply with comments. ——————————————————————————– Tableau Question 7. What is LOD (Level of detail) calculation? Leave your answers in […]
Regular calculation vs Table calculation in Tableau ?
As part of Tableau Questions and Answers series, I am asking questions related to Tableau and data warehousing concepts. I will encourage my students and other readers to explore the answers and reply with comments. ——————————————————————————– Tableau Question 6. What is the difference between a Regular calculation and a Table calculation in Tableau? Leave your answers in the […]
How Tableau connects to data
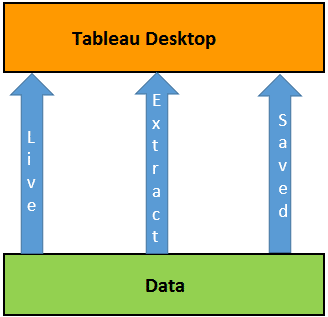
Tableau can connect to a variety of datasources in different ways. We will show you how Tableau connects to data. Tableau provides native connections to multiple datasources. Tableau can connect to the following datasources 1. Tableau can connect to datasources directly by creating a connection. 2. Tableau can connect to datasources as Live or Extract 3. Extract […]


 : http://techkoncepts.com/