


This blog explains how to dynamically change a chart based on Dimension selection in Tableau.
This article is an extension to my earlier blog How to dynamically generate a chart based on Measure selection
One of my reader posted this question – Can a Parameter have different data types and can it hold different values of different data types in the “List of Values”. To check the exact question and my response visit How to dynamically generate a chart based on Measure selection comment section.
A parameter can have only one data type, as it is a single parameter which can hold different kinds of values. In my above link example, the parameter “Param Measure Selector” holds the names of the measure values. How these Param values are used depends on the Calculated field where these values are used. It will throw an error if Numeric and Non-numeric values are used in the same calculated field.
Steps to dynamically generate a chart based on Dimension selection:
- Create a new workbook and connect to the data.
- Create a parameter – datatype as string. Select “Allowable Values” as “List” . Under the “List of Values” specify the “Value” as the name of your Dimensions.
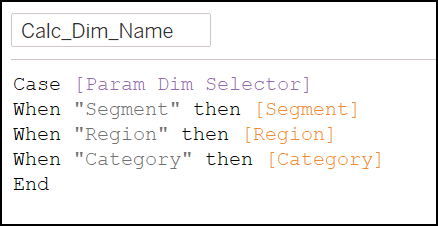
- Create a calculated field that will use this parameter. This calculated field will be used in creating the visualizations such as charts and tables.
- Display this parameter on the view. This parameter will be used to select measures to change the values in the visualizations.
How to dynamically change a chart based on Dimension selection in Tableau
Exercise:
- Launch Tableau desktop or Tableau public and connect to Sample – Superstore.xls. I am using Tableau 2019.1, the path to my file is \\Documents\My Tableau Repository\Datasources\2019.1\en_US-EU
- To learn how to connect to excel datasource visit Connecting to excel datasource in Tableau. This datasource comes with your Tableau desktop download.
- Use the Orders table/sheet available in this datasource and create a new sheet.
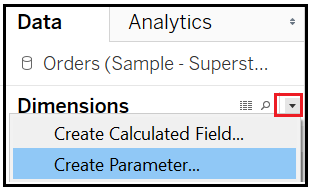
- Navigate to the Dimensions in the data section. Click on the small dropdown icon on the right and and select Create Parameter
5. Create a parameter using the settings below. This parameter will contain the Dimensions you want to use in the selection. Make sure that “Value” under list of values contains the exact Dimension names.
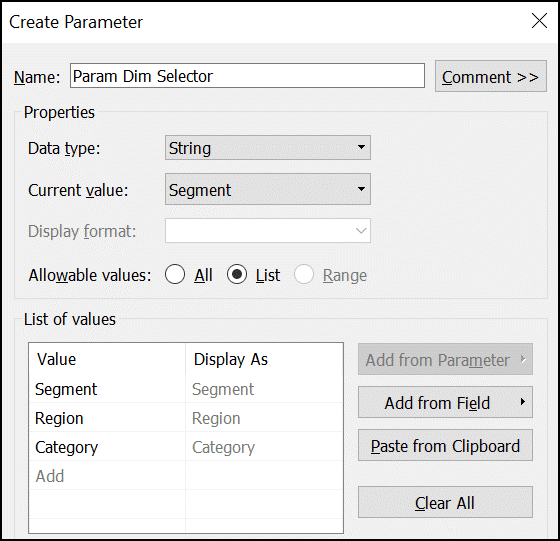
This will create a parameter Param Dim Selector below the measures.
6. Click on the drop down next to Dimensions and create a calculated field. This calculated field will use the parameter created in the previous step,
7. Create a visualization using this calculated field.
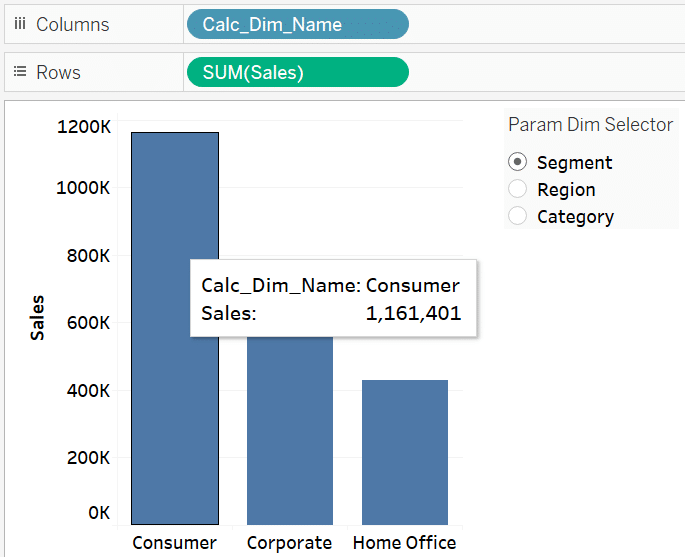
Drop Sales on Rows and Calc_Dim_Name on the Columns.
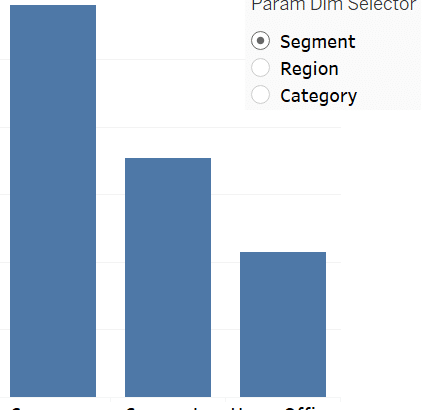
8. Right click anywhere on the white space on the view and select the Parameter Param Dim Selector created earlier.
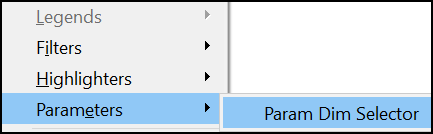
This will display parameter on the view and let users make a selection on the dimensions.
9. The final visualization will look like the following and will change the dimensions based on the selection.
—————-
Assignment
Are you interested in enhancing this chart or doing an exercise on this article, visit Displaying selected parameter over the chart


 : http://techkoncepts.com/