


In this Tableau assignment series, I will give you a simple practice exercise asking you how to go about displaying selected parameter over the chart and encourage you to solve it.
I recently posted a blog – How to dynamically change a chart based on dimension selection in Tableau.
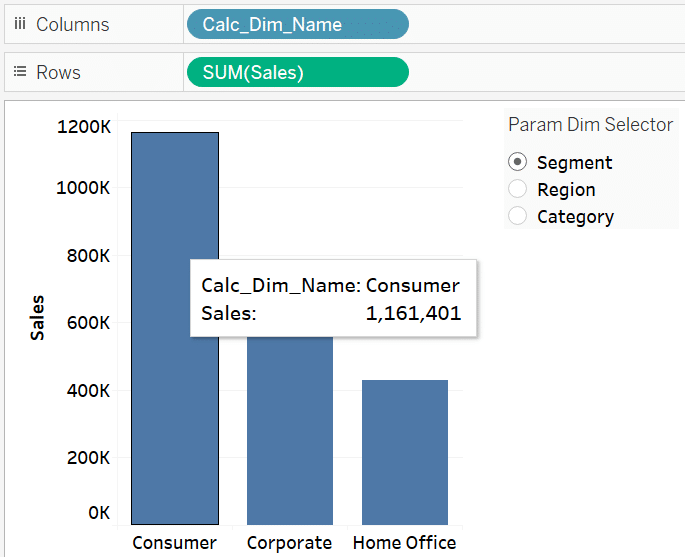
See below, the chart developed as part of this blog. It displays Calc_Dim_Name and Sales, when user hovers over the chart.
Exercise
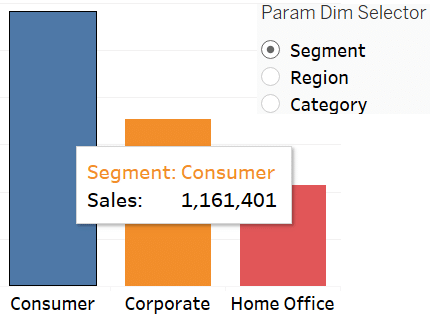
It will be more user friendly, if instead of Calc_Dim_Name, chart can display the selection made in Param Dim Selector.
Something like the below chart i.e. if Segment is selected, it should display Segment and if Region is selected it should display Region.
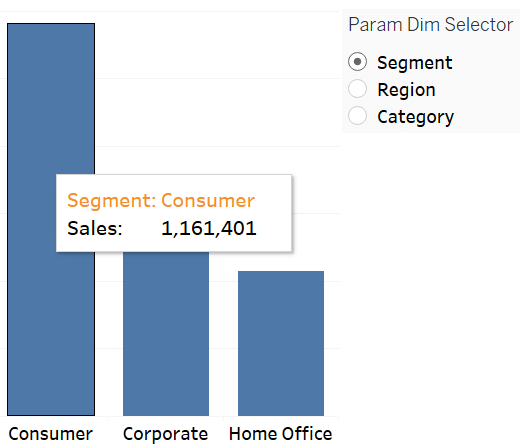
For this exercise, when the user hovers over the bar of the chart, the parameter selected (as shown in the chart above) should be displayed.
Share your answers in the comments below. If you cannot achieve it, please let me know and I will post the solution.


 : http://techkoncepts.com/