


Learning Tableau is a powerful first step into the world of data and analytics. But to build a full-time tech career, you need a broader plan—an IT Career Guide that connects your skills to real opportunities. But if you’re wondering “Where do I go from here?”, you’re not alone. Many Tableau learners struggle to connect […]
Tableau for Job Seekers — Your Guide to Data Skills and Career Readiness
I’m thrilled to announce the release of my new book — Tableau for Job Seekers: Performing Data Transformations, Designing Dynamic Visualizations, and Preparing for Tableau Roles (English Edition) Whether you’re just starting your data journey or actively preparing for Tableau roles, this book is designed to give you the skills, confidence, and clarity you need […]
How to display Dynamic Axis Title in Tableau
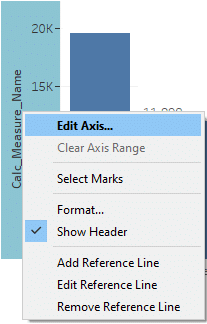
In this article we will learn what is dynamic axis title and how to display dynamic axis title in Tableau charts. What is Dynamic Axis Title ? Dynamic Axis title is a new feature in Tableau 2023. It is used to update/display the chart axis title based on the parameter selection or a single-value field. […]
Why knowledge of Excel is essential for Tableau
Tableau is often dubbed as “Excel on steriods”. However, even though Tableau is a powerful application, having knowledge of Excel remains essential for using Tableau effectively. Why knowledge of Excel is essential for Tableau The knowledge of Excel is crucial for learning Tableau due to the following reasons: Similar concepts. As beginners in Tableau, users […]
Proper function in Tableau 2023.1
Proper function is a new feature introduced in Tableau 2023.1. Checkout all the new features in Tableau 2023.1. What is Proper function Proper function converts a string to a proper casing by capitalizing the inital letter of each word, while lower casing all the other words. For example, if we change the string “what is […]
Dashboarding with Tableau
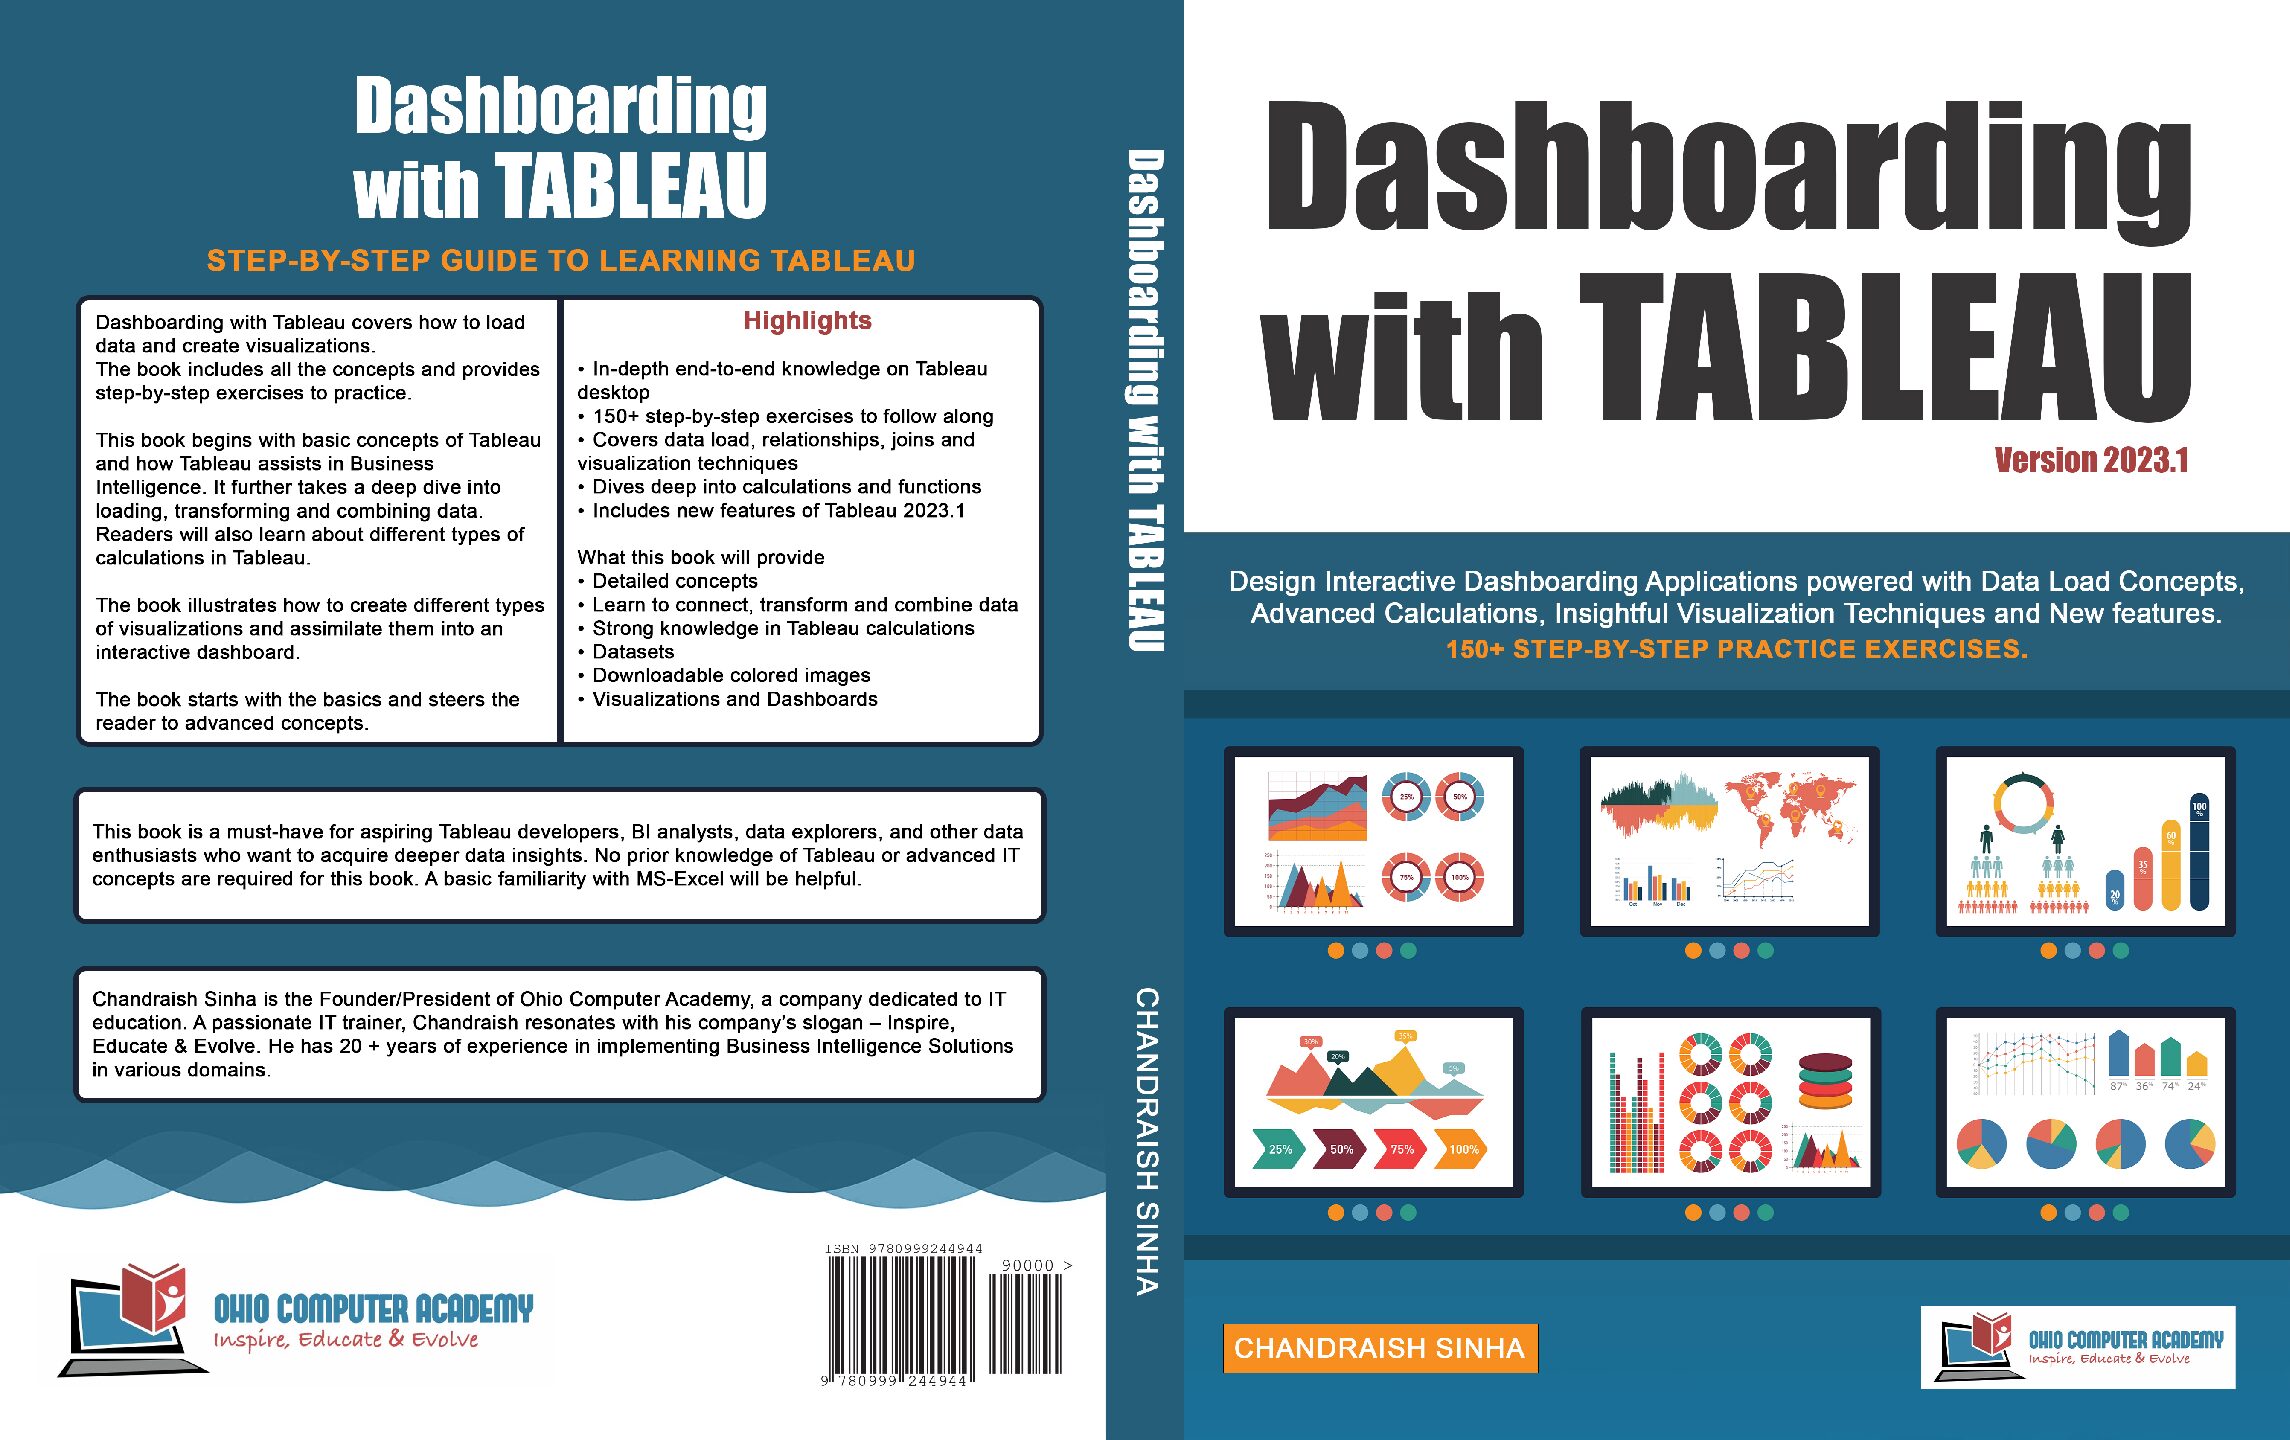
Tableau introduces new features with every version. Please checkout my new book – Dashboarding with Tableau. It explains all the concepts in detail and steers readers to advanced techniques and calculations. It covers Tableau version 2023.1. The book comes with downloadable code files and colored images. Key Features: In-depth end-to-end knowledge on Tableau Desktop 150+ […]
Error in using specific Date in a calculation in Tableau
In Tableau, sometimes we may have to perform calculations based on a specific date. For example, your user may be interested in knowing the Sales that occured on a specific day, or you may have to use this information in some other calculation, so how you will perform such a calculation. Conditional calculation such as: […]
Stack chart with multiple Measures and Totals
In this blog, I want to discuss how to create a Stacked bar chart with multiple measures and display totals at the end of the stack. In my earlier blog, I showed how to display total on a stacked bar chart in Tableau that stacked bar was created using only one measure and a dimension. The […]
Tableau viz to display New Year
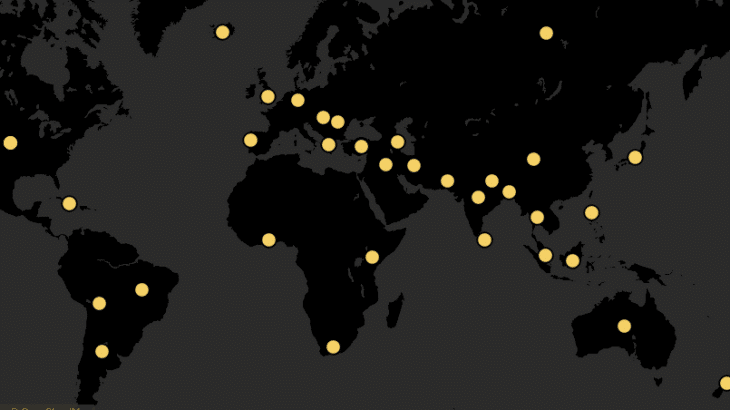
Using Tableau visualization, let’s find out which countries first experience New Year according to their location and time zone. It takes London as the base time. In this step-by-step tutorial, you will learn how to create such a Map and using Pages feature in Tableau you can animate it. For more details visit : Which […]
Clear filters in Tableau with example
Filters enhance your dashboards but if you have large number of filters on a Tableau dashboard, it becomes a nightmare for users to reset them. In this blog, I will discuss how to “Clear all filters in Tableau” with a single click. To clear or reset filters in Tableau: Create a “Reset sheet” with a […]


 : http://techkoncepts.com/