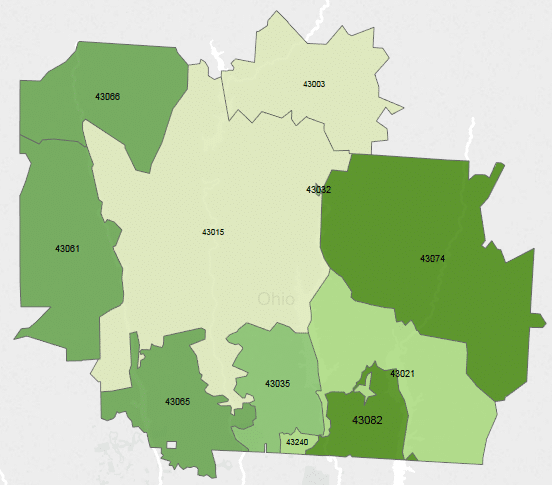
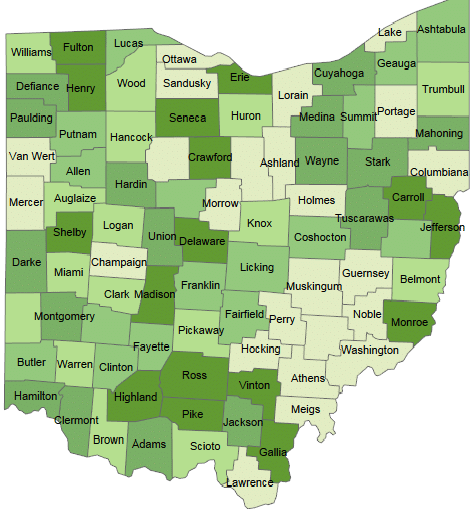
How to create different Charts in Tableau – Part 2

In my previous post how-to-create-different-charts-in-tableau-part-1  you have learned how to create Text table,Heat Maps,Maps and Pie charts. In this article i want to share with you some other types of charts. I will use Superstore.xls as data source. Superstore.xls comes with your Tableau installation and can be located in \Documents\My Tableau Repository\Datasources\ 1. Bar Chart Bar chart […]

Continue reading


How to Create Maps in Tableau

One of the strong features of Tableau is to create interactive Maps. Tableau automatically creates maps for the fields with geographical roles such as  Country, City, Zipcodes etc. Tableau automatically generates Longitudes and latitudes for such fields. In this blog, i will create a Map using OHIO counties and Zipcodes. I have created a sample data set using […]

Continue reading


Tableau – Color coding

It is very useful to perform color coding in your visualization. You can show values which are above or below a threshold value in a different color. In Tableau you can achieve this by using a calculated field. Steps: Create a visualization according to your requirements Create a calculated field on the column you want […]

Continue reading


Tableau – Applying filters

Filters can be applied in Tableau to dimensions and measures. Filters are a good way to answer questions on different data scenerios. Steps: Create visualization according to your requirements Understand the business rule for your filter Drop field which you want to use for filter on the “filter shelf” Tableau will prompt “How do you […]

Continue reading


Tableau – Data connection

Tableau can connect to variety of data sources. It can connect to excel files,relational data bases and many more. When you launch Tableau desktop on your machine, connect screen opens up. Here you can connect to your desired data source. If you have trial version of Tableau desktop then you can just connect to file based data sources. With […]

Continue reading