


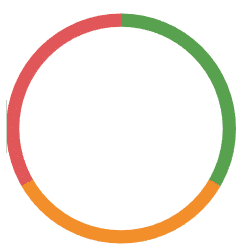
Donut chart is a variation of a Pie chart. Donut chart is more clear than a Pie chart where the size of the pie’s does not present clear picture to the user. I will show you how to create a Donut chart in Tableau. Pie and Donut chart are both used to display the percentage […]


 : http://techkoncepts.com/