


Recently, one of my client requested a dashboard where it is possible to do a year by year comparison in Tableau
The requirement – if you have two charts, user should be able to perform comparison between any two Years such as 2014 vs 2017.
I achieved this by creating a copy of the datasource in Tableau desktop.
Creating a copy of the data source in Tableau
1. Launch Tableau desktop and connect to the excel data source provided by Tableau, Sample – Superstore. Connect to Orders table.
This will create a datasource called Orders (Sample – Superstore).
![]()
2. Right click on the Orders (Sample – Superstore) and select Duplicate. This will create a copy of the datasource
![]()
3. Now using each datasource, you can create separate visualizations with Year filter . This will be done by creating two separate sheets. In Tableau, one sheet can contain one visualization.
From the menu, navigate to Worksheet and select New Worksheet ![]()
New worksheet can also be created from the bottom status bar, by clicking on the new sheet icon.
4. Create visualization using separate datasources created above. Place Region on Columns shelf and Sales on Rows. Place Region on the Color to get the colored bar. Create a Quick filter for Year on each chart.
5. To display these visualizations on the same view, create a Dashboard. To create a new dashboard, navigate to menu/Dashboard and select New Dashboard. ![]()
New dashboard can also be created from the bottom status bar, by clicking on the new Dashboard icon.
On the dashboard, from the list of sheets on the left, double click on the sheets to include them on the same view. 
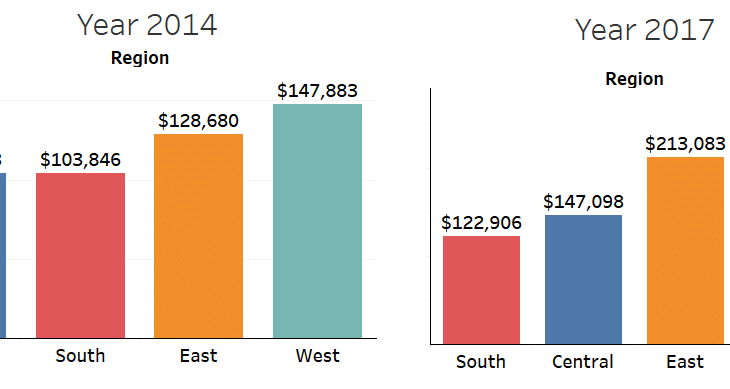
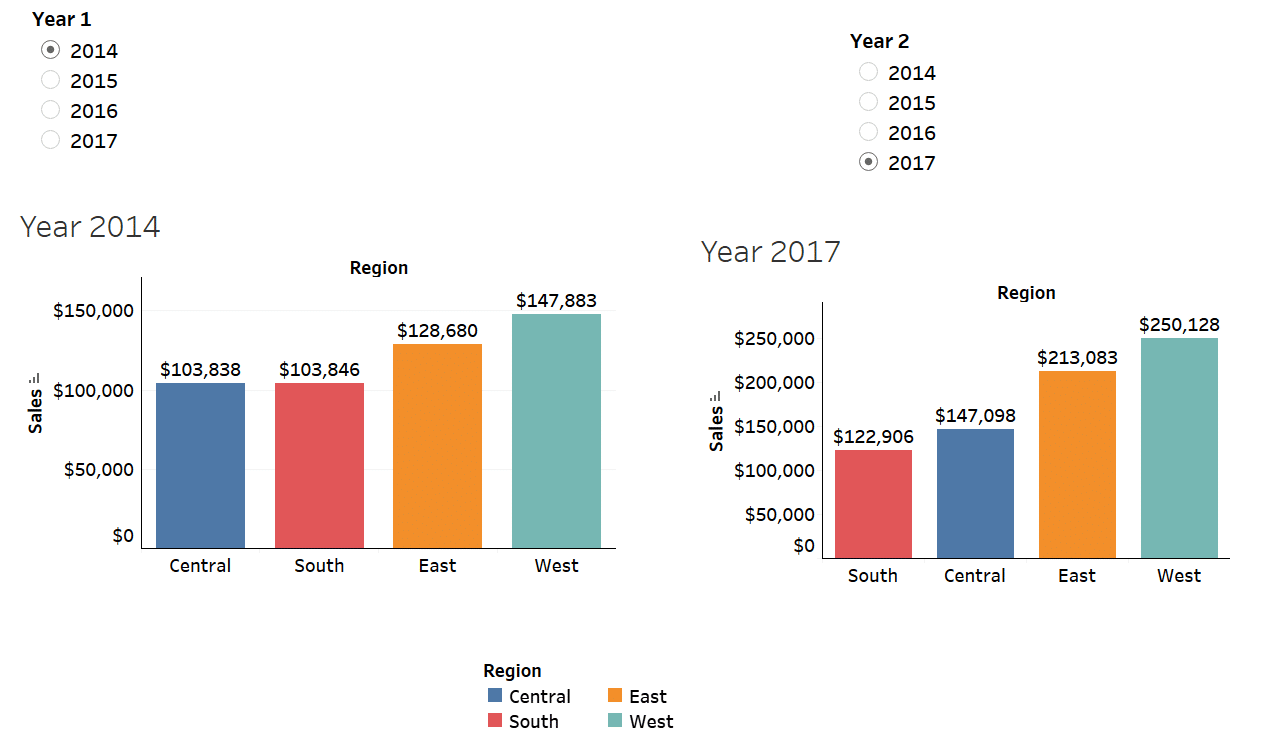
With little formatting like, removing All from the filters your dashboard will look like the one below, where you can compare charts using any Years.


 : http://techkoncepts.com/
Hi Chandraish
I tried the year by year comparison.I was able to complete it,but i was not able to arrange the bars in ascending order.
Please let me know ?
Thank You
To arrange the bars in ascending or descending order, you can use the sort icons in the tool bar.
Alternatively, on the chart, you can hover over the Sales on the Y-axis and click on the sort icon.
Hope this solves your issue.