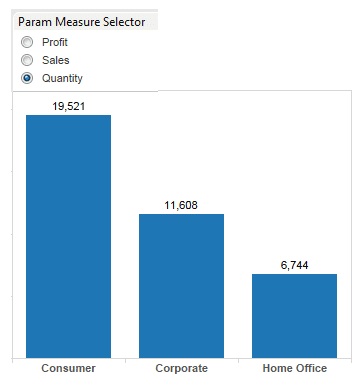
Important keywords in Tableau

Tableau is an awesome tool for creating visualizations. A developer will use Tableau desktop to create charts,tables and maps. Before starting on Tableau development, it is good know the important keywords and concepts as used in Tableau.  Important Keywords in Tableau 1. Data – When you launch Tableau desktop , the first thing you do, […]

Continue reading


How to create different Charts in Tableau – Part 2

In my previous post how-to-create-different-charts-in-tableau-part-1  you have learned how to create Text table,Heat Maps,Maps and Pie charts. In this article i want to share with you some other types of charts. I will use Superstore.xls as data source. Superstore.xls comes with your Tableau installation and can be located in \Documents\My Tableau Repository\Datasources\ 1. Bar Chart Bar chart […]

Continue reading


How to Create Maps in Tableau

One of the strong features of Tableau is to create interactive Maps. Tableau automatically creates maps for the fields with geographical roles such as  Country, City, Zipcodes etc. Tableau automatically generates Longitudes and latitudes for such fields. In this blog, i will create a Map using OHIO counties and Zipcodes. I have created a sample data set using […]

Continue reading


Tableau – Color coding

It is very useful to perform color coding in your visualization. You can show values which are above or below a threshold value in a different color. In Tableau you can achieve this by using a calculated field. Steps: Create a visualization according to your requirements Create a calculated field on the column you want […]

Continue reading