


In this article, I will cover how to display total on a stacked bar chart in Tableau. Stack chart is created to display the part of the whole.
Stack chart is similar to Bar chart, with each bar divided into different Categories.
In Tableau, when you create a Stack chart, it doesn’t automatically displays the Total on the top of each bar.
In this blog, i will discuss how to display total on a stacked bar chart.
Create a Stack a chart
- Connect to Sample-superstore dataset.
- Place Year(OrderDate) on Columns, Sum(Sales) on the Rows and Category on the Color on Marks. If Stack chart is not displayed, you can select one from Show Me.
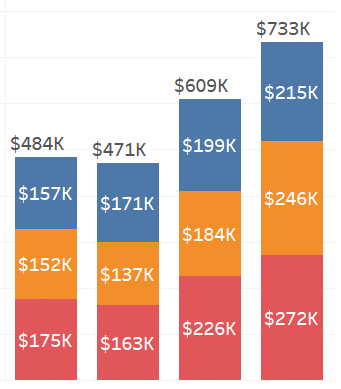
Your Stack chart will look like the following,

You can see that the overall Total on each bar is missing. It would be better, if apart from Category total we can get the overall Total for that Year.
How to display total on a stacked bar chart in tableau
This can be done using the reference line.
- On the same chart, right-click on the Y-axis and select Add Reference Line.
- Make the following settings,

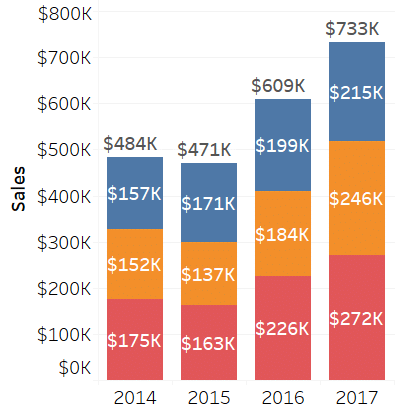
Your resulting chart will look like the one below,with Totals on the top of each bar.


 : http://techkoncepts.com/