


Cross table in Tableau is a special data structure where data is presented in a row and column format.
See an example of a cross table below. This is a Sales Report of some fictitious company. This report shows the sale of Products by Employees to respective customers.
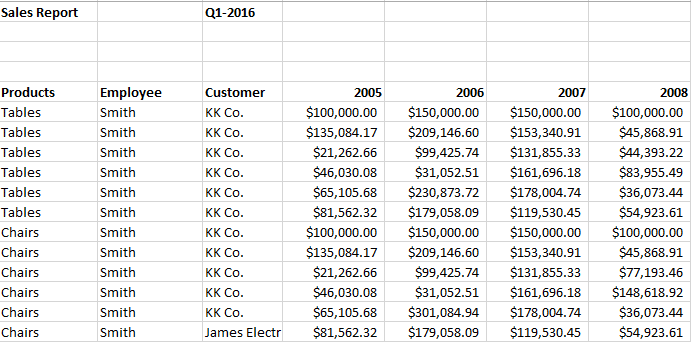
Cross Table example
Problems with loading Cross table in Tableau without any Transformation
For this exercise, I created the above sample report in excel.
We will load this report/crosstable in Tableau without any transformation and see the results. To learn how to load an excel in Tableau click here
When i load this table in Tableau, in the preview window, i can see that the table did not come across correctly.
Headers are wrong, there are Nulls in the header,Years are difficult to identify and so on.
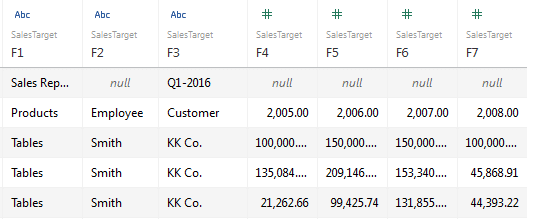
Incorrect format
If i create a chart using this data, it will be difficult to get useful analysis because Year by Year aggregation will not be possible.
To create useful visualization, our data should be in the following format.
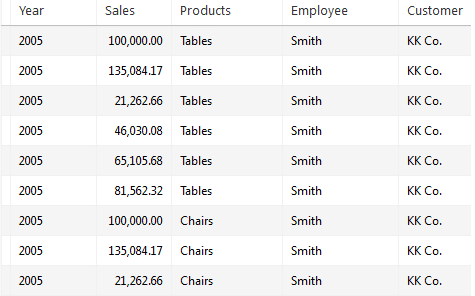
Desired format
We can transform original table to this desired format while loading it in Tableau.
Loading Cross Table in Tableau
- For your practice exercise, create a sample file/data in excel similar to screen shot above for “cross table example”. If you need, i will send you the data file and Tableau solution file.
- Launch Tableau desktop and select excel as your data connection. Browse to your file.
- In the preview window, you will notice that your file has an incorrect format, similar to second screen shot above “Incorrect format”
- Notice that Tableau automatically identifies the incorrect format and shows help from Data Interpreter.

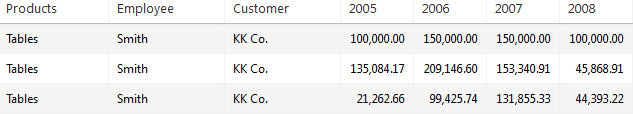
- Click on Turn on. Tableau will fix your file as below
6. This is still not in the right format, as per the above screen shot “Desired format”. For correct format, file should have Years and Sales in the separate columns.
7. To get the correct format, in the preview window, click on 2005 and shit + click on 2008. Click on the second drop down menu after 2008 and select Pivot
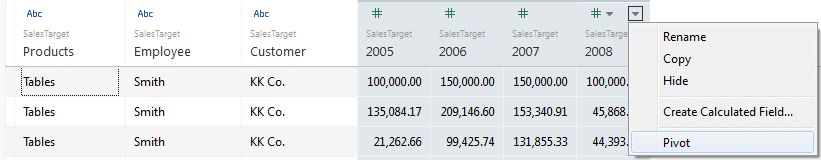
8. This will create separate columns for “Pivot field names” containing Year and “Pivot field values” containing Sales values. You can rename the headers to Year and Sales respectively.
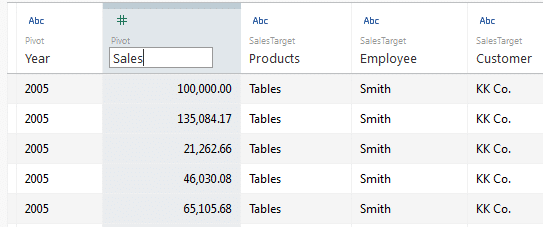
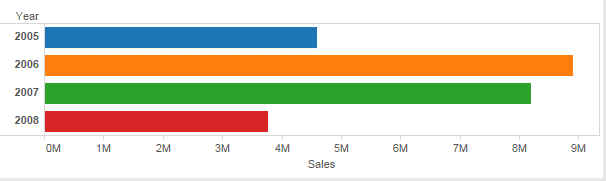
This loads the file in the desired format without changing the source/original data format. Now you can create any desired visualization.
Want to learn how to load cross table in QlikView, visit Cross table in QlikView


 : http://techkoncepts.com/